Electrical Activity of the Heart Related to the Normal EKG
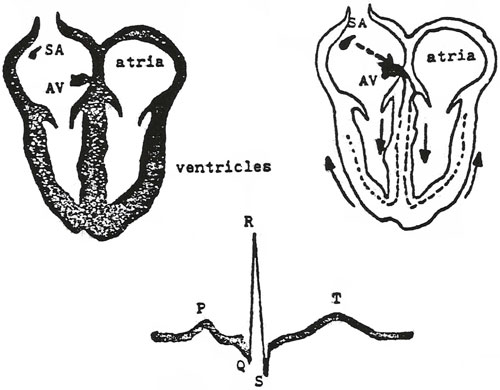
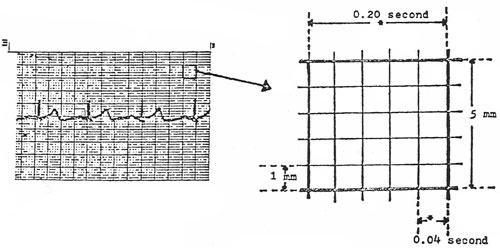
Represented in the diagram is the electrical pathway of the impulses through the heart. Each wave on the EKG is related to a portion of those impulses. When the heart muscle is stimulated by electrical impulses, blood is ejected from the corresponding chamber of the heart. Below are listed the waves of the EKG and the impulses which is the origin: P Wave: impulse going through the atria The SA node is referred to as pacemaker of the heart. This is where the electrical impulses originate, which eventually stimulate the entire cardiac cycle. The SA node is located near the top of the atrium and is also called the “normal physiological pacemaker.” The impulse then spreads form the atria to the AV node. The QRS complex being in the AV node which is located on the septum of the heart near the superior aspect of the ventricle. Both SA and AV nodes are innervated by the autonomic nervous system. Branches of the vagus nerve cause heart rate to slow or to increase. The T wav, as mentioned earlier, represents repolarization. The heart muscle is readying for the next contraction. There is electrical activity at this time, but it is related to recovery, not to an impulse to contract the heart muscle. The EKG Paper In order to begin understanding the interpretations of EKG’s one must have knowledge of the EKG paper. Shown in this illustration is one of the large blocks of the EKG paper. The time intervals are shown as well as the measurements of each block.
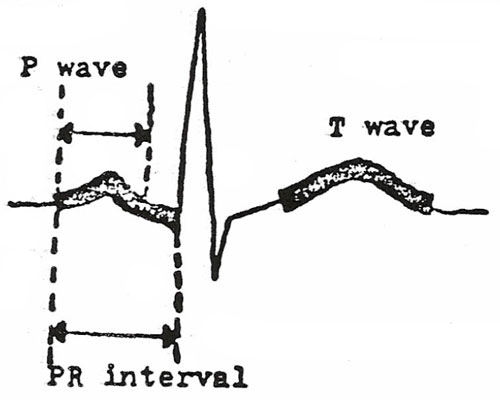
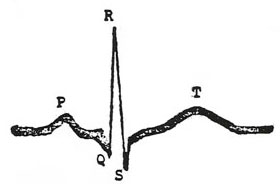
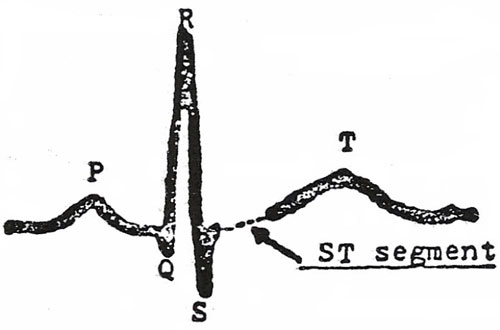
Measuring each wave of the EKG:
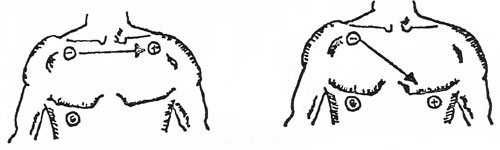
P Wave – 3 small blocks tall and 3 small blocks wide. T Wave – up to 10 small block high in the precordial leads; up to 5 small blocks high in the remaining leads. PR Interval – Up to 5 small blocks in length (0.20 seconds) will be lengthened if there is scarring to the area of the atrium and AV node area. QRS Complex – consists of Q wave, R wave, S wave the QRS complex refers to the ventricular impulse and the contraction. ST Segment – Begins at the end of the S wave and ends at the beginning of the T wave; if it is elevated, can mean an MI if it is depressed can mean hypoxia to the myocardium. The Locations of the EKG Leads and Their Significance: All leads of the EKG record the same electrical impulses of the heart muscle; however, each lead placed in a different area of the body records the electrical activity from a slightly different “angle”. This means that by using the EKG tracing from different positions, various EKG waves will be accentuated. The diagnosis of arrhythmias may be made easier by examination of different leads. The 12-ead EKG tracing is standard. Six leads are recorded by placing wires on each limb. Si leads are recorded by placing wires on the chest in different positions. Limb Leads: I, II, III, IV, V, VI Lead IV also called AVR Chest Leads: V1, V2, V3, V4, V5, V6 For diagnosis of most arrhythmias, lead II is most commonly used. Lead II and the chest leads, most consistently show the most clear P wave, which can be diagnostic of many common arrhythmias. The following leads are listed to show their relationship to areas of the myocardium: V1, AVR – right side of heart If changes in the EKG tracing are seen in a group of the above leads, this disease can be localized to a particular area of the heart. In the case of an MI which shows changes in leads V1 and AVR only, the damage ot he heart is in the right side. If the MD can thus localize the damage to the heart they can usually diagnose other possible problems in the heart. Valvular problems may show up as a specific change in one or more leads of the EKG tracing. Blockages in one of the major arteries of veins, may show up as an altered deflection in the EKG. Following is a diagram of the chest and the placement of leads on the chest, so as to trace leads I and II. When the patient is being monitored for a specific arrhythmia, it will help to connect the wires to the spot on the chest which will show that the arrhythmia most clearly. In assessing the electrical activity of the heart, the nurse should obtain vital signs, including the apical pulse. Rate and rhythm abnormalities will indicate that there is a problem which requires an EKG tracing. EKG interpretation is a lengthy course which would be too long to discuss here.
Next: Electrical Activity of the Heart Related to the Normal EKG, Con't. |